 The P&L as Profit Driver

The Profit and Loss Statement (P&L) is the score card of each monthís activity. It lists Food and Beverage sales and other revenues and their operating expenses for the month. The bottom line is how much money you made or lost during the month, the final score.
Many operators take a quick look at the bottom line, grunt in disgust and go back to work. The P&L shouldnít be a cause for indigestion, but a tool to help you manage your business. The problem is that many P&Lís do not provide meaningful information. It is not that the information you need is not there, but that it is not presented in a useful way.
If you use Quick Books, the canned profit and
loss was designed for a general business, not for a Food & Beverage establishment. If you use an outside CPA firm to do your accounting, they probably issue a P&L designed to help them report your income to the government for tax purposes, but offer no real information to help you.
The answer may be to create your own P&L in Excel and organize it in a manner that allows you to see where you are making money and where you are losing it. There should be a current month comparison between this year and last year and a year to date comparison between this year and last year. Both sets of data should have a variance column. In addition, each column should be followed by a percentage column. The percentages are the keys to understanding your P&L. They tell you the percentage of total revenues each line item represents. The bottom line is the percentage of revenues left in net profit.
When you read a profit and loss presented in a useful format and understand its components, you can use it to drive your profits. The P&L alerts you to costs that are too high and could potentially drive you out of business. For example, if the current month P&L shows Food Cost to be 45% and last year, your Food Cost for the same month was 35%, you know you have a problem.
By knowing you have a problem, you can research the cause of the problem and take corrective action. You can talk to the chef and discuss possible causes for the high Food Cost. Was there excessive spoilage or waste during the month? Has the sales mix changed by customers buying more high cost menu items than in prior months? Have ingredient costs increased without a corresponding adjustment to menu prices? Are the portion sizes larger than you had planned? Are freezers and coolers locked at night? Is Receiving properly secured so product cannot leave through the back door?
The million dollar question, of course, is how do you know when your expenses are too high? Comparing sales amounts and expense percentages from one month to the next and to last year will give you a perspective based on past results. Comparing your percentages, particularly product cost percentages and payroll percentages, to industry averages will give you an idea of where you stand in comparison to the rest of the industry. The National Restaurant Association has industry statistics available on its website for a fee.
If you use Quick Books, the canned P&L lists every General Ledger income and expense account and its balance for the current month. One of the report options allows you to print a year to date
profit and loss. You can use these figures to drop into your Excel P&L, formatted in a way that provides you with the information you need.
Sales should be broken down by Food, Liquor, Beer, and Wine. Product Cost (Cost of Sales) should not be a one line item, but should be broken down in the same categories as your sales. These percentages are the only costs that are not divided by Total Revenues. The percentage column should divide each cost item by its corresponding sales category so you calculate Food Cost Percentage (Food Cost divided by Food Sales), Liquor Cost Percentage (Liquor Cost divided by Liquor Sales), Beer Cost Percentage, and Wine Cost Percentage.
Payroll, Taxes, and Benefits should be listed in a separate section of the P&L. As Total Wages, Taxes, and Benefits are one of the largest expenses on your
Profit and Loss, the Wages, Taxes, and Benefits percentage is key to understanding the impact these expenses have to your profitability.
Operating expenses are the other expenses you incur in running your business. These include expenses such as Cleaning Supplies, Repairs & Maintenance, Equipment Rental, Linens, Garbage Service, Utilities, Advertising, Office Supplies, Rent, Depreciation, Licenses, etc.
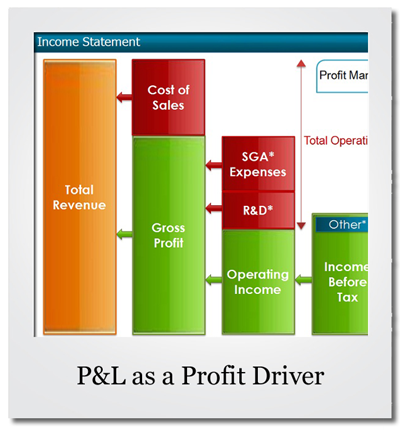
Revenues minus Product Cost minus Labor minus Operating Costs equal Net Profit Before Taxes. Federal and State Income Taxes are subtracted to obtain Net Profit After Taxes. This is the amount you get to keep, and/or reinvest in the business.
Many restaurant owners know how to run the business but do not fully understand how to read their financial statements. They need a financial partner to put the numbers into a useful format and translate the data into English, something they can understand. The restaurant owner should meet periodically with his Accountant to discuss the financial results. This discussion should include how the business is doing, how it compares to last month, last year, and industry averages. Understanding the results will help the owner make better operating decisions that will ultimately make the business more profitable.
(RETURN)
